Dow recovered from early losses & broke into the black gaining 19, advancers over decliners 3-2 & NAZ inched up 1. Bank stocks are recovering despite dismal earnings reports.
The MLP & REIT indices were each up 1+ while junk bond funds & Treasuries were little changed. Oil slipped back after being flattish for the last month. Gold had big fall from a 3-week high as the dollar’s rally reduced demand for it as an alternative asset.


Get the latest market update below:

Photo: Yahoo
Goldman Sachs posted a wider-than-expected loss in Q3, only its 2nd quarterly loss as a public company. It was hurt by sharp declines in the value of investment securities & customer trading assets. CEO Blankfein cited difficult market conditions & a lack of confidence among investors & corporate clients for the poor results. "Our results were significantly impacted by the environment and we were disappointed to record a loss in the quarter," Blankfein said. The loss-driver was its Investing & Lending division, which holds stocks, bonds, loans & private equity assets as long-term investments. It reported negative revenue of $2.48B as the value of those assets dropped sharply. The stock investment in Industrial and Commercial Bank of China alone generated more than $1B of paper losses. In addition, GS was hurt by big declines in bond trading & investment banking revenue. Revenue totaled $3.6B, down 60% from a year earlier & down 51% from the Q2. The Q3 loss amounted to 84¢ compared with a profit of $2.98 last year & analysts expected a loss of 16¢. The stock rose 1.68 after having a very rough year.
Goldman Sachs Posts Third-Quarter Loss
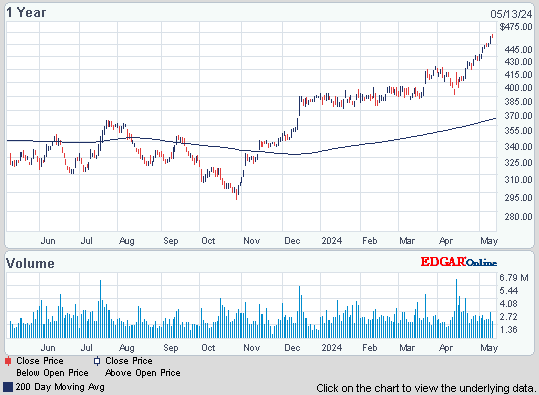
Photo: Yahoo
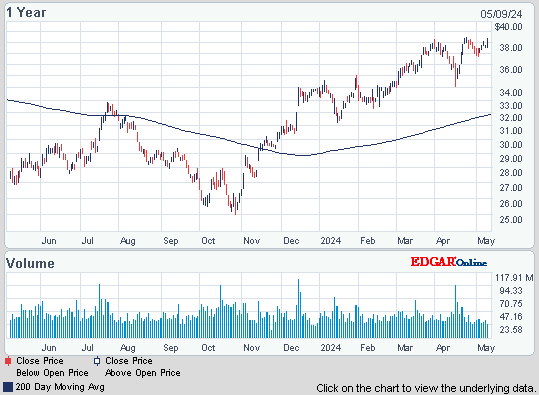
Bank of America, a Dow stock, posted a Q3 profit, helped by accounting gains & asset sales, but the main businesses showed signs of weakness as lending profits dropped & expenses rose. The bank also slipped to #2 among US bank ranked by assets, ceding the top spot to JPMorgan Chase (JPM), another Dow stock. The accounting gains & asset sales offset a 15% drop in loan income. EPS was 56¢ compared with a loss 77¢ last year earlier (when it took a $10B accounting charge). It recorded $9.8B in pretax benefits from the sale of China Construction Bank shares & 2 accounting gains. The pretax loss of $2.2B related to private equity & "strategic investments." Net interest income, what the bank makes on loan interest, fell to $10.7B from $12.7B last year (important because it reflects ongoing business activity). The net interest margin, what it makes in loan interest versus what it pays for deposits, shrank to 2.32% from 2.72%. Major banks also posted shrinking lending margins in Q3. Overall, total revenue increased 6% to $28.7B. But the stock gained 35¢.
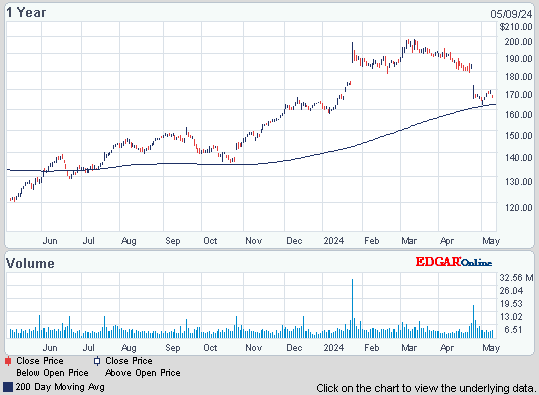
3 Dow stocks reported weak to so- so earnings. IBM missed sales estimates for the first time in 5 qtrs. Johnson & Johnson's profit fell 6% because of larger overhead & production costs, & a one-time charge offsetting higher foreign sales. Coca-Cola Q3 profit rose 8%, as it offset higher costs with price increases & volume grew worldwide. IBM fell $8+ & the other 2 slipped pennies.
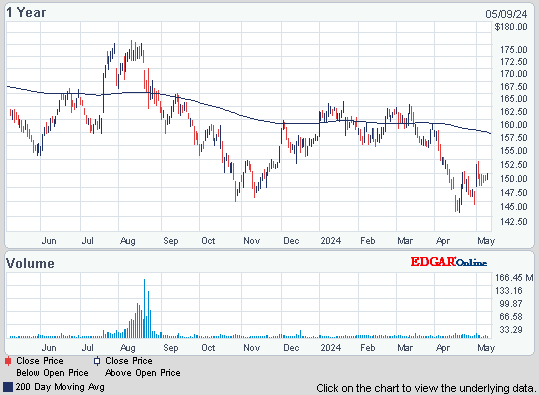
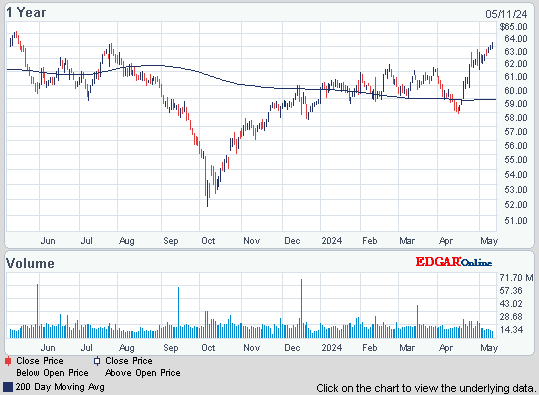
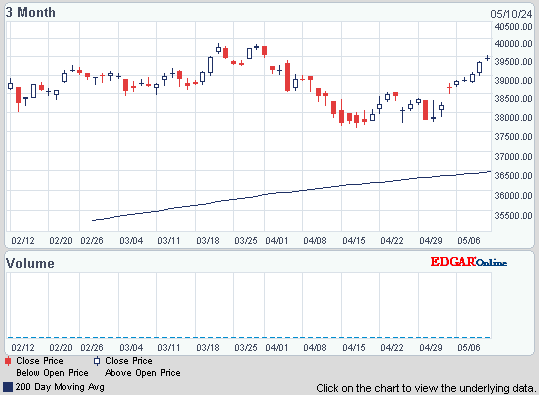
Bank earnings are just plain dreary but that seems to be baked into the markets. The Financial Index still has a dreary chart & banks are considered to be market leaders. Earnings from industrial companies are not great, reflecting sluggishness in the US recovery. No dramatic news on the European debt mess, as they try to patch a broken system. The US economy is stuck in neutral . The chart below shows Dow has failed to break thru the 11.6K ceiling 3, not a very good sign!
S&P 500 Financials Sector Index
| Value | 167.19 | |
| Change | 2.97 (1.8%) |
The MLP & REIT indices were each up 1+ while junk bond funds & Treasuries were little changed. Oil slipped back after being flattish for the last month. Gold had big fall from a 3-week high as the dollar’s rally reduced demand for it as an alternative asset.
ALERIAN MLP Index (^AMZ)
DJ REIT INDEXDJR (^DJR)
Treasury yields:
U.S. 3-month | 0.020% | |
U.S. 2-year | 0.270% | |
U.S. 10-year | 2.123% |
| CLX11.NYM | ...Crude Oil Nov 11 | ...86.20 | ..... | (0.2%) |
| GCV11.CMX | ...Gold Oct 11 | ......1,642.60 | ... | (2.0%) |
Get the latest market update below:
Photo: Yahoo
Goldman Sachs posted a wider-than-expected loss in Q3, only its 2nd quarterly loss as a public company. It was hurt by sharp declines in the value of investment securities & customer trading assets. CEO Blankfein cited difficult market conditions & a lack of confidence among investors & corporate clients for the poor results. "Our results were significantly impacted by the environment and we were disappointed to record a loss in the quarter," Blankfein said. The loss-driver was its Investing & Lending division, which holds stocks, bonds, loans & private equity assets as long-term investments. It reported negative revenue of $2.48B as the value of those assets dropped sharply. The stock investment in Industrial and Commercial Bank of China alone generated more than $1B of paper losses. In addition, GS was hurt by big declines in bond trading & investment banking revenue. Revenue totaled $3.6B, down 60% from a year earlier & down 51% from the Q2. The Q3 loss amounted to 84¢ compared with a profit of $2.98 last year & analysts expected a loss of 16¢. The stock rose 1.68 after having a very rough year.
Goldman Sachs Posts Third-Quarter Loss
Goldman Sachs Group, Inc. (The) (GS)
Photo: Yahoo
Bank of America, a Dow stock, posted a Q3 profit, helped by accounting gains & asset sales, but the main businesses showed signs of weakness as lending profits dropped & expenses rose. The bank also slipped to #2 among US bank ranked by assets, ceding the top spot to JPMorgan Chase (JPM), another Dow stock. The accounting gains & asset sales offset a 15% drop in loan income. EPS was 56¢ compared with a loss 77¢ last year earlier (when it took a $10B accounting charge). It recorded $9.8B in pretax benefits from the sale of China Construction Bank shares & 2 accounting gains. The pretax loss of $2.2B related to private equity & "strategic investments." Net interest income, what the bank makes on loan interest, fell to $10.7B from $12.7B last year (important because it reflects ongoing business activity). The net interest margin, what it makes in loan interest versus what it pays for deposits, shrank to 2.32% from 2.72%. Major banks also posted shrinking lending margins in Q3. Overall, total revenue increased 6% to $28.7B. But the stock gained 35¢.
Bank of America Corporation (BAC)
3 Dow stocks reported weak to so- so earnings. IBM missed sales estimates for the first time in 5 qtrs. Johnson & Johnson's profit fell 6% because of larger overhead & production costs, & a one-time charge offsetting higher foreign sales. Coca-Cola Q3 profit rose 8%, as it offset higher costs with price increases & volume grew worldwide. IBM fell $8+ & the other 2 slipped pennies.
International Business Machines Corporation (IBM)
Johnson & Johnson (JNJ)
Coca-Cola Company (The) (KO)
Bank earnings are just plain dreary but that seems to be baked into the markets. The Financial Index still has a dreary chart & banks are considered to be market leaders. Earnings from industrial companies are not great, reflecting sluggishness in the US recovery. No dramatic news on the European debt mess, as they try to patch a broken system. The US economy is stuck in neutral . The chart below shows Dow has failed to break thru the 11.6K ceiling 3, not a very good sign!
Dow Industrials (INDU)
Find out what's inside Trend TV!
Get your favorite symbols' Trend Analysis TODAY!!




No comments:
Post a Comment