Dow was under water nearly all day, but losses were limited. It finished down 27, decliners ahead of advancers 3-2 & NAZ lost 15. Bank stocks continued weak, the Financial Index dropped 2½ to the 196s.
MLPs recovered in the PM which limited the loss for the index to 1 in the 407s while the REIT index fell 2 to the 242s. Junk bond funds were higher & Treasuries had a good day. Oil was even at its 9 month highs. Gold shot up 20 in late day trading, taking it near its 2012 highs.

![Live 24 hours gold chart [Kitco Inc.]](http://www.kitco.com/images/live/gold.gif)

Treasuries rose for the first time in 4 days on speculation the Greek rescue package won’t resolve the region’s debt crisis & as the Treasury sold $3B of 5-year notes. The yield on the 10-year Treasury fell from a 4-week high when Fitch lowered Greece’s credit rating & said a default is highly likely. The Federal Reserve bought $1.8B of longer-maturity Treasuries today. The Treasury will sell $29B in 7-year notes tomorrow, the final of 3 auctions this week totaling $99B. The yield on the current 5-year note fell 4 basis points to 0.86%. The yield on the benchmark 10-year bond fell 5 basis points to 2.01%, the most in a month. The 5-year notes sold today drew a yield of 0.90% (annualized rate), essentially matching the forecast. The bid-to-cover ratio was 2.89X, compared with an average of 2.9X for the previous 10 sales. Indirect bidders (including foreign central banks) purchased 41.8% of the notes, the least since Jul which compares with an average of 43.8% for the past 10 sales. Direct bidders, non-primary dealer investors that place their bids directly with the Treasury, purchased 12.9%, compared with an average of 11.7% at the last 10 auctions. This auction was considered routine after a month long decline in Treasury prices.
Treasuries Remain Higher as Five-Year Note Auction Yield Trails Forecast
Photo: Yahoo
Saks Q4 income climbed 48%, topping forecasts, from strong sales of handbags, fine jewelry & men's & women's clothing. The high priced reatiler bounced back from the recession much quicker than others because the wealthy returned to spending faster than middle- to low-income shoppers have. But CEO Sadove said that SKS must still work hard to keep pace with its shoppers' needs, "Our customers are more discerning and demanding than ever before, and our future depends on our ability to successfully and quickly evolve with the customer." For Q4, EPS was 21¢, sharply ahead of 14¢ last year. Removing store closing costs, impairment charges & other items, EPS was 17¢, topping 14¢ forecasted. Annual revenue climbed 8% to $3B & revenue at stores open at least a year increased 9.5%. For fiscal 2012, SKS expects revenue at stores open at least a year to rise 5-7% & also expects profit margins to get slightly larger, mostly in H2.
Saks 4Q profit rises on sale of luxury goods AP

Toll Brothers had a Q1 loss as the biggest luxury homebuilder reported a modest decline in home deliveries & a higher cancellation rate. But it also saw an increase in net signed contracts & backlog, a key barometer of future home deliveries.. CEO Yearley said that the company is starting to see a recovery in areas such as the Detroit & Phoenix suburbs & the east coast of Florida. "Although historically, our first quarter is the most challenging time to gauge sentiment among home buyers, in general the market feels healthier than it did one year ago," he said. Yearley also said that TOL is seeing continued strength in the Northeast corridor from Washington, D.C to Boston, which represents 60% of its business. EPS was a loss of 2¢ which compares with EPS of 2¢ a year earlier. Revenue declined 4% to $322M from $334M, missing the forecast of $359M. Home deliveries dipped 1% to 564 units, while net signed contracts rose 19% to 652 units. The average price of those contracts was $682K compared with $561K a year earlier. Backlog climbed 21% to 1,784 units, while the cancellation rate rose to 6.2% from 5.7% a year earlier. It anticipates that it will deliver 2600-3200 homes in 2012 at an average price of $550K-575K per home. The stock fell 1.22 (5%).
Toll Brothers Declines After Builder Reports Unexpected Loss on Expenses

This was another sluggish day for stocks as Dow failed to push above 13K. While not major, the loss was troublesome because S&P 500 stalled at a key technical level & Dow gave up when it should have been able to set new multi year highs. Obama is proposing a lower tax rate for corps. Sounds good, but there are also tax increases to make it tax "neutral." The markets treated it as another election year promise which doesn't mean much. Iran is the big unknown for the oil markets which has a lot to do with the health of economies around the world. Plenty to be worried about, but Dow takes it all in stride.

MLPs recovered in the PM which limited the loss for the index to 1 in the 407s while the REIT index fell 2 to the 242s. Junk bond funds were higher & Treasuries had a good day. Oil was even at its 9 month highs. Gold shot up 20 in late day trading, taking it near its 2012 highs.
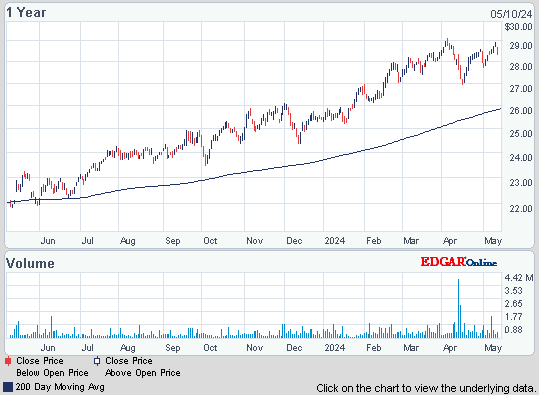
JPMorgan Chase Capital XVI (AMJ)
Click below for the latest market update:
Treasury yields:
U.S. 3-month | 0.081% | |
U.S. 2-year | 0.293% | |
U.S. 10-year | 2.003% |
| CLJ12.NYM | ...Crude Oil Apr 12 | ...106.21 | .... | (0.0%) |
![Live 24 hours gold chart [Kitco Inc.]](http://www.kitco.com/images/live/gold.gif)

Treasuries rose for the first time in 4 days on speculation the Greek rescue package won’t resolve the region’s debt crisis & as the Treasury sold $3B of 5-year notes. The yield on the 10-year Treasury fell from a 4-week high when Fitch lowered Greece’s credit rating & said a default is highly likely. The Federal Reserve bought $1.8B of longer-maturity Treasuries today. The Treasury will sell $29B in 7-year notes tomorrow, the final of 3 auctions this week totaling $99B. The yield on the current 5-year note fell 4 basis points to 0.86%. The yield on the benchmark 10-year bond fell 5 basis points to 2.01%, the most in a month. The 5-year notes sold today drew a yield of 0.90% (annualized rate), essentially matching the forecast. The bid-to-cover ratio was 2.89X, compared with an average of 2.9X for the previous 10 sales. Indirect bidders (including foreign central banks) purchased 41.8% of the notes, the least since Jul which compares with an average of 43.8% for the past 10 sales. Direct bidders, non-primary dealer investors that place their bids directly with the Treasury, purchased 12.9%, compared with an average of 11.7% at the last 10 auctions. This auction was considered routine after a month long decline in Treasury prices.
Treasuries Remain Higher as Five-Year Note Auction Yield Trails Forecast
Photo: Yahoo
Saks Q4 income climbed 48%, topping forecasts, from strong sales of handbags, fine jewelry & men's & women's clothing. The high priced reatiler bounced back from the recession much quicker than others because the wealthy returned to spending faster than middle- to low-income shoppers have. But CEO Sadove said that SKS must still work hard to keep pace with its shoppers' needs, "Our customers are more discerning and demanding than ever before, and our future depends on our ability to successfully and quickly evolve with the customer." For Q4, EPS was 21¢, sharply ahead of 14¢ last year. Removing store closing costs, impairment charges & other items, EPS was 17¢, topping 14¢ forecasted. Annual revenue climbed 8% to $3B & revenue at stores open at least a year increased 9.5%. For fiscal 2012, SKS expects revenue at stores open at least a year to rise 5-7% & also expects profit margins to get slightly larger, mostly in H2.
Saks 4Q profit rises on sale of luxury goods AP
Saks Incorporated (SKS)
Toll Brothers had a Q1 loss as the biggest luxury homebuilder reported a modest decline in home deliveries & a higher cancellation rate. But it also saw an increase in net signed contracts & backlog, a key barometer of future home deliveries.. CEO Yearley said that the company is starting to see a recovery in areas such as the Detroit & Phoenix suburbs & the east coast of Florida. "Although historically, our first quarter is the most challenging time to gauge sentiment among home buyers, in general the market feels healthier than it did one year ago," he said. Yearley also said that TOL is seeing continued strength in the Northeast corridor from Washington, D.C to Boston, which represents 60% of its business. EPS was a loss of 2¢ which compares with EPS of 2¢ a year earlier. Revenue declined 4% to $322M from $334M, missing the forecast of $359M. Home deliveries dipped 1% to 564 units, while net signed contracts rose 19% to 652 units. The average price of those contracts was $682K compared with $561K a year earlier. Backlog climbed 21% to 1,784 units, while the cancellation rate rose to 6.2% from 5.7% a year earlier. It anticipates that it will deliver 2600-3200 homes in 2012 at an average price of $550K-575K per home. The stock fell 1.22 (5%).
Toll Brothers Declines After Builder Reports Unexpected Loss on Expenses
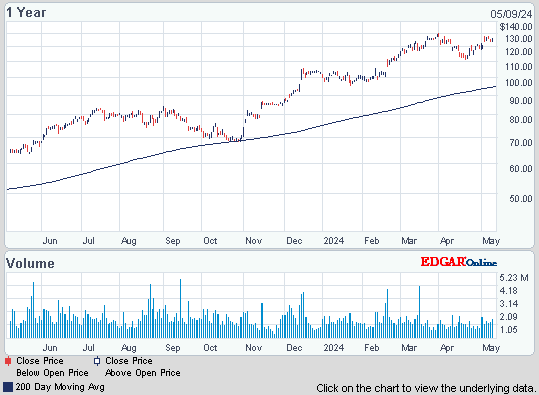
Toll Brothers Inc. (TOL)
This was another sluggish day for stocks as Dow failed to push above 13K. While not major, the loss was troublesome because S&P 500 stalled at a key technical level & Dow gave up when it should have been able to set new multi year highs. Obama is proposing a lower tax rate for corps. Sounds good, but there are also tax increases to make it tax "neutral." The markets treated it as another election year promise which doesn't mean much. Iran is the big unknown for the oil markets which has a lot to do with the health of economies around the world. Plenty to be worried about, but Dow takes it all in stride.
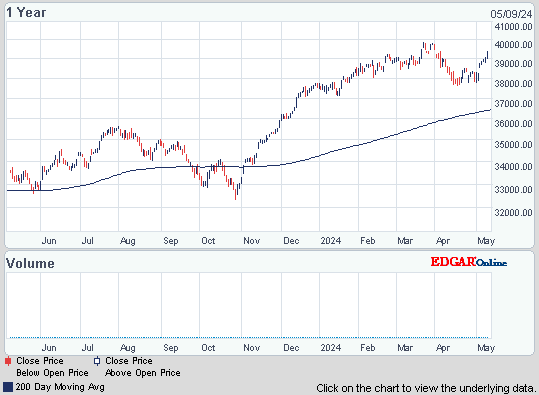
Dow Industrials
Get your favorite symbols' Trend Analysis TODAY!


No comments:
Post a Comment