

Markets surged all day, closing at the highs. The Dow gained 272, advancers over decliners a relatively modest 5-2 & NAZ had a muted gain of 33 (held back by Apple, see below). Banks led the rally, on optimism about European debt mess was getting straightened out.
After starting the day lower, the MLP index rose & the REIT index was up 3 to 210. Junk bond funds were mixed to lower & Treasuries sold off after their recent rally. Oil rose in sympathy with the stock market. Selling in gold continued. Nobody is sure how or why, but most feel that some mysterious holders had to raise cash, forcing the sales. Fundamental demand over the longer term is viewed as strong.

![Live 24 hours gold chart [Kitco Inc.]](http://www.kitco.com/images/live/gold.gif)


Photo: Bloomberg
Apple (AAPL) is cutting orders to vendors in the supply chain for its iPad tablet computer, a move that may result in slower sales for Chinese companies. Several vendors indicated in the past 2 weeks that AAPL lowered Q4 iPad orders 25%, the first such cut that analysts have ever seen. The cut could mean a drop to 13M units in Q4 from 17M units in Q3. Reduced orders could reflect both weakening demand in Europe due to economic conditions there as well as a strategy by AAPL to operate with reduced inventory. So far, AAPL is not talking. The iPad may account for 73% of tablet sales this year, according to Gartner & tablets that run on Google (GOOG) Android operating system will probably have about 17% of the market. AAPL fell 1.13 to $403 after reaching $422 last week.
Apple Trims Orders for IPad Parts: JPMorgan
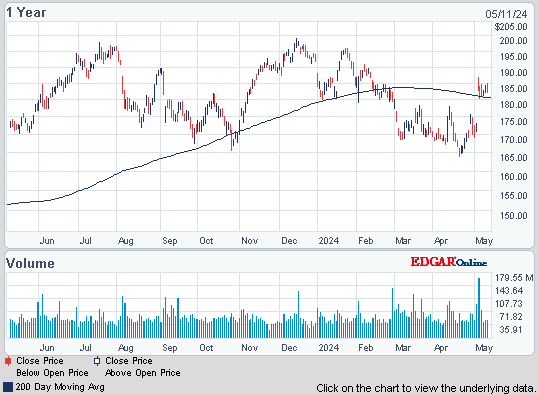

Photo: Bloomberg
Warren Buffett is sending a signal that he believes Berkshire Hathaway is undervalued by announcing (for the first time) a plan to repurchase stock. BRK.A will repurchase its Class A & B shares when they are trading within 10% of book value. The Class A stock jumped 8.1% , or $8129, to $108,449. At the end of Jun, book value per share was worth $98,716 per Class A share. That estimate doesn't include the $9B acquisition of Lubrizol that was completed earlier this month. Last week, Class A shares dipped below $100K for the first time since Jan 2010 as worries about the economy weighed down the overall market.
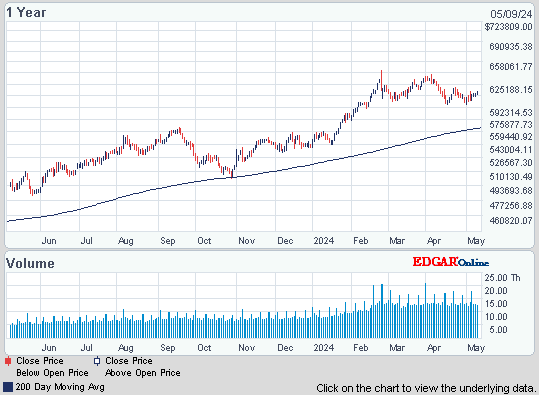

Photo: Bloomberg
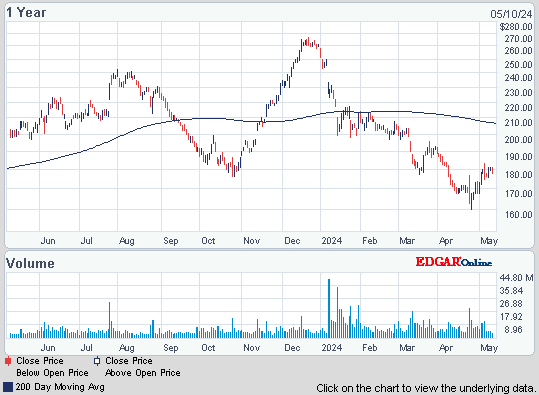
Boeing, a Dow stock, rose the most in 6 weeks as it delivered the 787 Dreamliner, ending more than 3 years of delays on the first jetliner with a fuselage made of carbon-fiber composites. All Nippon Airways received the plane at the BA factory in Washington. The twin-engine 787 is the best selling jet ever, with 821 orders from 56 customers. BA is working to boost output to 10 per month by the end of 2013. The Dreamliner is part of a strategy to help reclaim the top spot in industry, lost to Airbus in 2003. The composite body is lighter than traditional aluminum, cutting fuel use. Upgrades such as LED lighting & larger windows are designed to improve passengers’ in-flight experience. The stock rose 2.50.
Boeing Rises Most in Six Weeks on 787 Delivery
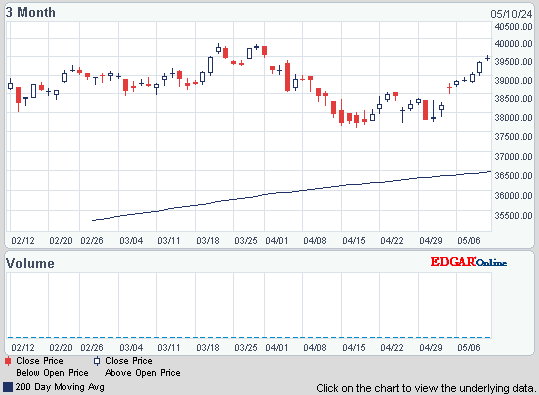
There was no dramatic news suggesting the kind of gain the Dow had. Maybe it was just bargain hunters coming back after the sharp drop last week. Bargain hunting is alive & well. Warren Buffett's proposed stock purchase was encouraging. But breadth in the markets was weak. The VIX, volatility index, fell 2+ to 39, but is still in high territory. We are also approaching the close of the month & especially the end of the Q3 which could be causing adjustments not readily explained.
SPX Volatility Index (^VIX)

S&P 500 Financials Sector Index
| Value | 164.43 | |
| Change | 6.95 (4.4%) |
After starting the day lower, the MLP index rose & the REIT index was up 3 to 210. Junk bond funds were mixed to lower & Treasuries sold off after their recent rally. Oil rose in sympathy with the stock market. Selling in gold continued. Nobody is sure how or why, but most feel that some mysterious holders had to raise cash, forcing the sales. Fundamental demand over the longer term is viewed as strong.
Alerian MLP Index
| Value | 342.89 | |
| Change | 1.67 (0.5%) |
Click below for the latest market update:
Treasury yields:
U.S. 3-month | 0.005% | |
U.S. 2-year | 0.227% | |
U.S. 10-year | 1.900% |
| CLX11.NYM | Crude Oil Nov 11 | 80.70 |  0.85 (1.1%) 0.85 (1.1%) |
Apple (AAPL) is cutting orders to vendors in the supply chain for its iPad tablet computer, a move that may result in slower sales for Chinese companies. Several vendors indicated in the past 2 weeks that AAPL lowered Q4 iPad orders 25%, the first such cut that analysts have ever seen. The cut could mean a drop to 13M units in Q4 from 17M units in Q3. Reduced orders could reflect both weakening demand in Europe due to economic conditions there as well as a strategy by AAPL to operate with reduced inventory. So far, AAPL is not talking. The iPad may account for 73% of tablet sales this year, according to Gartner & tablets that run on Google (GOOG) Android operating system will probably have about 17% of the market. AAPL fell 1.13 to $403 after reaching $422 last week.
Apple Trims Orders for IPad Parts: JPMorgan
Apple Inc. (AAPL)
Warren Buffett is sending a signal that he believes Berkshire Hathaway is undervalued by announcing (for the first time) a plan to repurchase stock. BRK.A will repurchase its Class A & B shares when they are trading within 10% of book value. The Class A stock jumped 8.1% , or $8129, to $108,449. At the end of Jun, book value per share was worth $98,716 per Class A share. That estimate doesn't include the $9B acquisition of Lubrizol that was completed earlier this month. Last week, Class A shares dipped below $100K for the first time since Jan 2010 as worries about the economy weighed down the overall market.
Berkshire Hathaway Inc. (BRK/A)
Boeing, a Dow stock, rose the most in 6 weeks as it delivered the 787 Dreamliner, ending more than 3 years of delays on the first jetliner with a fuselage made of carbon-fiber composites. All Nippon Airways received the plane at the BA factory in Washington. The twin-engine 787 is the best selling jet ever, with 821 orders from 56 customers. BA is working to boost output to 10 per month by the end of 2013. The Dreamliner is part of a strategy to help reclaim the top spot in industry, lost to Airbus in 2003. The composite body is lighter than traditional aluminum, cutting fuel use. Upgrades such as LED lighting & larger windows are designed to improve passengers’ in-flight experience. The stock rose 2.50.
Boeing Rises Most in Six Weeks on 787 Delivery
Boeing Company (The) (BA)
There was no dramatic news suggesting the kind of gain the Dow had. Maybe it was just bargain hunters coming back after the sharp drop last week. Bargain hunting is alive & well. Warren Buffett's proposed stock purchase was encouraging. But breadth in the markets was weak. The VIX, volatility index, fell 2+ to 39, but is still in high territory. We are also approaching the close of the month & especially the end of the Q3 which could be causing adjustments not readily explained.
SPX Volatility Index (^VIX)
Dow Industrials (INDU)
Get your favorite symbols' Trend Analysis TODAY!
Find out what's inside Trend TV
No comments:
Post a Comment