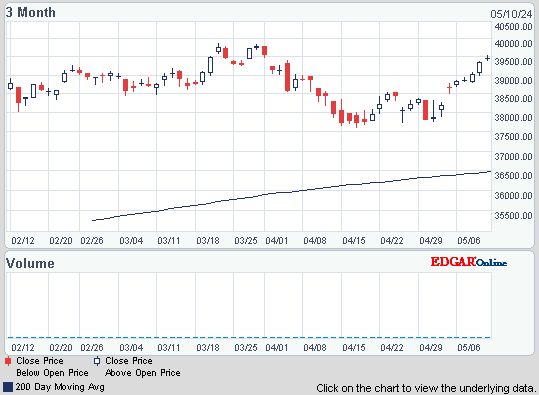
Dow sank 240 finishing at the lows, decliners over advancers 3-1 & NAZ sold off 65. The Financial Index dropped a very big 6 to 159, just a few points above its 2½ lows set 2 weeks ago. This group of market leaders has a very dreary chart! The MLP index fell 2 to just above 240 & the REIT index was off 6 to the 203s. Junk bond funds dropped about 1% but Treasuries were strong as the yield on the 10 year Treasury is solidly below 2% again. Oil was lower along with the stock market but gold managed a modest gain in what has been its worst qtr in some time.


![Live 24 hours gold chart [Kitco Inc.]](http://www.kitco.com/images/live/gold.gif)


This has been a dreary month, as expected, & an even worse Q3. Dow dropped 700 in Sep & 12% in Q3. MLPs & REITs had similar kind of performances. Stock markets have nothing going for them. The European credit crisis drones on & the latest squiggles in the drama are negative. The US economy is stuck in neutral while DC is deeply divided on how to deal with it. Stock in neutral is applied to the economy because of all the uncertainty about the future (especially with higher taxes & reduced gov spending). Business is holding back expansion plans. Now Q4 begins with Oct, which is best remembered for some of the ugliest days in market's history.


ALERIAN MLP Index (^AMZ)
DJ REIT INDEXDJR (^DJR)
Treasury yields:
U.S. 3-month | 0.010% | |
U.S. 2-year | 0.251% | |
U.S. 10-year | 1.907% |
| CLX11.NYM | ...Crude Oil Nov 11 | ...79.26 | ... | (3.5%) |
![Live 24 hours gold chart [Kitco Inc.]](http://www.kitco.com/images/live/gold.gif)

Click below the latest market update:
This has been a dreary month, as expected, & an even worse Q3. Dow dropped 700 in Sep & 12% in Q3. MLPs & REITs had similar kind of performances. Stock markets have nothing going for them. The European credit crisis drones on & the latest squiggles in the drama are negative. The US economy is stuck in neutral while DC is deeply divided on how to deal with it. Stock in neutral is applied to the economy because of all the uncertainty about the future (especially with higher taxes & reduced gov spending). Business is holding back expansion plans. Now Q4 begins with Oct, which is best remembered for some of the ugliest days in market's history.
Volatility Index (^VIX)
Dow Industrials (INDU)
Get your favorite symbols' Trend Analysis TODAY!
Find out what's inside Trend TV


No comments:
Post a Comment