Stocks started strong,but the sellers are back. Dow is off 115, decliners ahead of advancers almost 4-1 & NAZ fell 44. Banks are market leaders, but on the way down as the Financial Index is at its lowest levels in 16 months.
The Alerian MLP Index dropped another whopper 8+ to the 336s (54 below its highs earlier this year) & the REIT index fell 3 to the 216s. Junk bond funds were mixed as were Treasuries (at their lofty levels. Oil & gold were also marking time on mixed signals from the unemployment report.


Photo: Yahoo
Employers added 117K jobs according to the Labor Dept, better than the past 2 months which were also revised higher. Still, the economy needs twice as many net jobs per month to rapidly reduce unemployment. The rate has topped 9% in every month except 2 since the recession officially ended in 2 years ago. Businesses added 154K jobs across many industries but govs cut 37K. However, 23K of those losses were because of the shutdown of the Minnesota state gov. The unemployment rate fell to 9.1% from 9.2% in Jun partly because some unemployed workers stopped looking for work so that they are no longer counted as unemployed. The number of unemployed fell to 13.9M, down from 14.1M. The participation rate, which measures the percentage of people working or searching for jobs, fell to 63.9%, the lowest in 27 years! This data is less bad than feared, but continues not to be encouraging.
Payrolls Rose in July; Jobless Rate at 9.1%
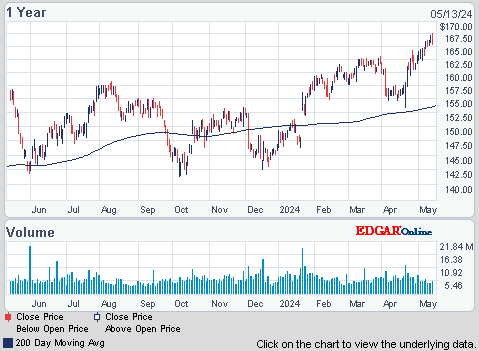
Procter & Gamble, a Dow stock & Dividend Aristocrat, Q4 revenue & profit jumped by double digits on strong sales in emerging markets such as China & India. But PG expects a slowdown this qtr as the US & other developed economies struggle. EPS rose 10% to 84¢, up 10% & beat expectations of 82¢ on revenue of $20.57B. PG expects EPS for the year ahead to be in a range of $4.17-$4.33 with sales growing 5-9%. Analysts expect EPS of $4.29 of $87B (up 5%). The stock was up 12¢.

Markets tried to regain steam after the jobs report, but that as not meant to last. The MLP index looks to be in bad shape after crashing thru the important 350 support level yesterday. Investors want higher yields. Unless sellers go home early, this has the making of another dreary day. Sorry I have to run, but have a tooth situation to deal with.

S&P 500 Financials Sector Index
| Value | 180.30 | |
| Change | -3.68 (-2.0%) |
The Alerian MLP Index dropped another whopper 8+ to the 336s (54 below its highs earlier this year) & the REIT index fell 3 to the 216s. Junk bond funds were mixed as were Treasuries (at their lofty levels. Oil & gold were also marking time on mixed signals from the unemployment report.
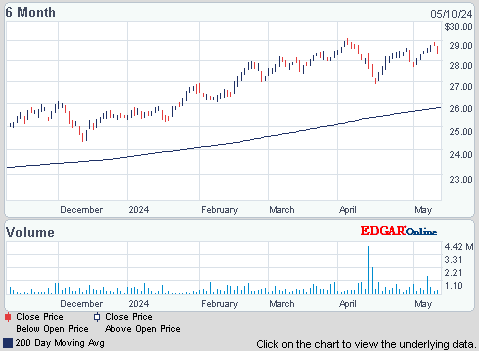
JPMorgan Chase Capital XVI (AMJ)
Treasury yiels:
U.S. 3-month | 0.005% | |
U.S. 2-year | 0.284% | |
U.S. 10-year | 2.467% |
| CLU11.NYM | ...Crude Oil Sep 11 | ...86.48 | ... |
| GCQ11.CMX | ...Gold Aug 11 | ....1,655.60 | ... | (0.0%) |
Click below to get the latest market update:

Photo: Yahoo
Employers added 117K jobs according to the Labor Dept, better than the past 2 months which were also revised higher. Still, the economy needs twice as many net jobs per month to rapidly reduce unemployment. The rate has topped 9% in every month except 2 since the recession officially ended in 2 years ago. Businesses added 154K jobs across many industries but govs cut 37K. However, 23K of those losses were because of the shutdown of the Minnesota state gov. The unemployment rate fell to 9.1% from 9.2% in Jun partly because some unemployed workers stopped looking for work so that they are no longer counted as unemployed. The number of unemployed fell to 13.9M, down from 14.1M. The participation rate, which measures the percentage of people working or searching for jobs, fell to 63.9%, the lowest in 27 years! This data is less bad than feared, but continues not to be encouraging.
Payrolls Rose in July; Jobless Rate at 9.1%
Procter & Gamble, a Dow stock & Dividend Aristocrat, Q4 revenue & profit jumped by double digits on strong sales in emerging markets such as China & India. But PG expects a slowdown this qtr as the US & other developed economies struggle. EPS rose 10% to 84¢, up 10% & beat expectations of 82¢ on revenue of $20.57B. PG expects EPS for the year ahead to be in a range of $4.17-$4.33 with sales growing 5-9%. Analysts expect EPS of $4.29 of $87B (up 5%). The stock was up 12¢.
Procter & Gamble Company (The) (PG)
Markets tried to regain steam after the jobs report, but that as not meant to last. The MLP index looks to be in bad shape after crashing thru the important 350 support level yesterday. Investors want higher yields. Unless sellers go home early, this has the making of another dreary day. Sorry I have to run, but have a tooth situation to deal with.
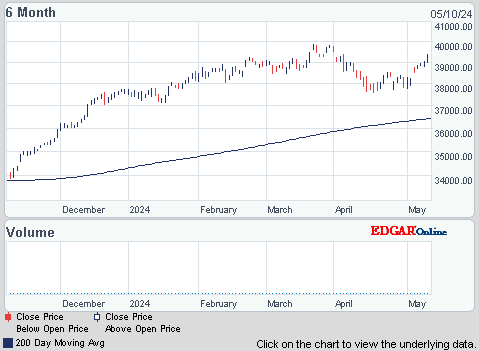
Dow Industrials (INDU)
Find out what's inside Trend TV
Get your favorite symbols' Trend Analysis TODAY!


No comments:
Post a Comment