

Dow tumbled 276 (off almost 1.2K from its high 3 months ago), decliners ahead of advancers 7-1 & NAZ sank 76. Banks are leading the selling with the Financial Index at levels not seen in almost a year!
MLPs & REITs are having another ugly day with the Alerian MLP Index going just below the important 350 level. Junk bond funds slipped. but Treasuries are strong. The yield on the 10 year Treasury is getting closer to the 2.4% low reached last year & 2+% lows reached during the recession. Oil dropped on gloomy economic thoughts & gold reaches yet another record.
Get the latest daily market update below:


Photo: Yahoo
The number seeking unemployment benefits dipped last week as weekly applications edged down 1K to 400K according to the Labor Dept (the lowest level in 4 months) after the previous week's figure was revised upward from 398K to 401K. The 4-week average dropped for the 5th straight week to 407K, suggesting a downward trend in layoffs. Applications have been at or above 400K for 17 weeks. The Fri jobs report is expected to show employers added 90K jobs & the unemployment rate is expected to remain unchanged at 9.2%. While that would represent improvement from Jun, when the economy added just 18K (fewest in 9 months), the economy needs at least 3 times as many new jobs to substantially reduce the unemployment rate.
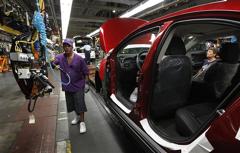
Photo: Yahoo
General Motors reported profits doubled in Q2 from higher prices for its vehicles worldwide. EPS was $1.54, ahead of 85¢ last year. This was GM's 3rd straight quarterly profit since its IPO & 6th straight overall. GM CFO Dan Ammann said the company gained $1B from higher prices for cars & trucks & more than half of that came from North America. GM also has raised prices to compensate for the higher cost of raw materials such as steel. Revenue rose 19% to $39.4B, while sales rose 7% to 2.3M cars & trucks. Although sales softened somewhat in the US & Europe because of worries about the economy, GM gained market share in every region outside South America. Although GM made $5.7B in H1, Ammann said H2 performance will probably not be as robust, since there is usually a drop in sales in the fall & the economy remains shaky. "There's a high level of uncertainty out there," he said. The stock fell 65¢ & is sharply below the $33 IPO price.
GM profit doubles as global sales and prices riseAP

Photo: Yahoo
Kraft Foods, a Dow stock, is breaking up just 18 months after driving through the controversial acquisition of UK chocolate maker Cadbury, into a growing snacks business& a stable but slower growing general grocery business that includes Oscar Mayer lunch meat & Kraft cheese. KFC said that it expects a tax-free spin-off of the North American grocery business to be completed by the end of 2012. KFT is the latest consumer goods company to separate its units in order to focus them better & offer shareholders distinct investment opportunities. The stock rose 1.14 in the down market.

The crisis about raising the debt ceiling is over (at least for the time being), but markets continue to sell off big time. YTD, S&P 500 & NAZ are lower & Dow is just barely in the black. It sure feels like the US economy & to a lesser extent the rest of the world are slipping into another recessionary period. If that is the case, there is little the Federal Reserve can do & having the gov pump more money into the economy is not an option. During these dreary time, smart investors will be looking for attractive companies to set target prices for future purchases.
S&P 500 Financials Sector Index
| Value | 188.62 | |
| Change | -5.41 (-2.8%) |
MLPs & REITs are having another ugly day with the Alerian MLP Index going just below the important 350 level. Junk bond funds slipped. but Treasuries are strong. The yield on the 10 year Treasury is getting closer to the 2.4% low reached last year & 2+% lows reached during the recession. Oil dropped on gloomy economic thoughts & gold reaches yet another record.
JPMorgan Chase Capital XVI (AMJ)
Get the latest daily market update below:
Treasury yields:
U.S. 3-month | 0.005% | |
U.S. 2-year | 0.300% | |
U.S. 10-year | 2.541% |
| CLU11.NYM | ....Crude Oil Sep 11 | ...90.39 | ..... | (1.7%) |
| GCQ11.CMX | ...Gold Aug 11 | .....1,678.50 | ... | (0.9%) |
Photo: Yahoo
The number seeking unemployment benefits dipped last week as weekly applications edged down 1K to 400K according to the Labor Dept (the lowest level in 4 months) after the previous week's figure was revised upward from 398K to 401K. The 4-week average dropped for the 5th straight week to 407K, suggesting a downward trend in layoffs. Applications have been at or above 400K for 17 weeks. The Fri jobs report is expected to show employers added 90K jobs & the unemployment rate is expected to remain unchanged at 9.2%. While that would represent improvement from Jun, when the economy added just 18K (fewest in 9 months), the economy needs at least 3 times as many new jobs to substantially reduce the unemployment rate.
Photo: Yahoo
General Motors reported profits doubled in Q2 from higher prices for its vehicles worldwide. EPS was $1.54, ahead of 85¢ last year. This was GM's 3rd straight quarterly profit since its IPO & 6th straight overall. GM CFO Dan Ammann said the company gained $1B from higher prices for cars & trucks & more than half of that came from North America. GM also has raised prices to compensate for the higher cost of raw materials such as steel. Revenue rose 19% to $39.4B, while sales rose 7% to 2.3M cars & trucks. Although sales softened somewhat in the US & Europe because of worries about the economy, GM gained market share in every region outside South America. Although GM made $5.7B in H1, Ammann said H2 performance will probably not be as robust, since there is usually a drop in sales in the fall & the economy remains shaky. "There's a high level of uncertainty out there," he said. The stock fell 65¢ & is sharply below the $33 IPO price.
GM profit doubles as global sales and prices riseAP
General Motors Company (GM)

Photo: Yahoo
Kraft Foods, a Dow stock, is breaking up just 18 months after driving through the controversial acquisition of UK chocolate maker Cadbury, into a growing snacks business& a stable but slower growing general grocery business that includes Oscar Mayer lunch meat & Kraft cheese. KFC said that it expects a tax-free spin-off of the North American grocery business to be completed by the end of 2012. KFT is the latest consumer goods company to separate its units in order to focus them better & offer shareholders distinct investment opportunities. The stock rose 1.14 in the down market.
Kraft Foods Inc. (KFT)
The crisis about raising the debt ceiling is over (at least for the time being), but markets continue to sell off big time. YTD, S&P 500 & NAZ are lower & Dow is just barely in the black. It sure feels like the US economy & to a lesser extent the rest of the world are slipping into another recessionary period. If that is the case, there is little the Federal Reserve can do & having the gov pump more money into the economy is not an option. During these dreary time, smart investors will be looking for attractive companies to set target prices for future purchases.
Dow Industrials (INDU)
Find out what's inside Trend TV
Get your favorite symbols' Trend Analysis TODAY!
No comments:
Post a Comment