

Dow sank 437 taking it well below 11K, decliners over advancers better than 3-1 & NAZ dropped 82 after yesterday's huge gain. Bank stocks sold off again, the chart for the Financial Index looks awful!
MLPs are defying the down markets. The index rose 5+ to the 347s but the REIT index fell almost 5 to 209. Junk bond funds pulled back 3% (big in that world) even though a continuation of low rates should be a plus. Treasuries are still in high demand around the world, seen as a "safe haven" investment. Oil rose from a 10-month low amid speculation that the Federal Reserve will implement a Q3 to bolster the economy & on signs that US crude supplies are shrinking. Gold gained for a 3rd session as a protection of wealth. Its 30 day chart is unbelievable.


Employers posted more job openings in Jun, a sign that hiring might improve a bit in the coming months. The Labor Dept said the number of available jobs rose to 3.1M, up from 3M in May to the highest level since Mar. Of course, this data is 40 days old already. Roughly 4.5 unemployed people, on average, were competing for each available job in Jun, down slightly from 4.6 in May. In a healthy economy, the ratio is about 2 to 1. The Jun number was higher than the 2.1M posted in Jul 2009, just after the recession officially ended & the lowest total since the gov began recording data a decade ago. But it's also significantly below the 4.4M openings in Dec 2007, when the recession began. High unemployment remains a burden on the recovery.
Job openings rose in June, though levels are low AP
Polo Ralph Lauren fiscal Q1 profit surged 52% on better-than-expected sales overseas & in the retail segment. The performance was well above expectations, & it raised its fiscal 2012 revenue guidance. RL, with brands including Polo by Ralph Lauren, Chaps & Club Monaco, had EPS of $1.90 for the qtr ending Jul 2, up from $1.21 last year. Analysts were expecting $1.44. Revenue climbed 33% to $1.53B as both retail & wholesale sales improved, handily beating $1.41B forecasted. Revenue from stores open at least a year rose 19%, while online sales climbed 28%. RL expects fiscal 2012 revenue to climb at a mid-to-high teens percentage rate, higher than its prior forecast of a mid-teens increase. Analysts expect revenue of $6.53B. For its Q2, RL anticipates revenue will rise at a high-teens-to-low 20% rate & analysts expects $1.76B in revenue. Even on a dismal day like today, good news can bring out buyers. The stock rose 7.70 (6½%).
Polo Ralph Lauren 1Q profit surges, lifts outlook AP
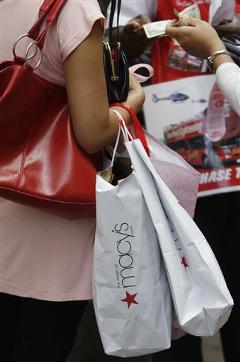
Photo: Yahoo
Macy's reported a 64% increase in Q2 profit as its strategy of tailoring merchandise to local markets is helping to overcome an overall sluggishness in the economy. CEO Terry J. Lundgren described Q2 as "the most successful second quarter and spring season in more than a decade." EPS climbed to 55¢ from 35¢ last year & revenue rose 7.3% to $5.94B. Analysts were expecting EPS of 48¢ on revenue of $5.84B. Revenue at stores opened at least a year rose 6.4%. "To date this year, we have driven significant additional sales growth, gained market share, maintained strong margins, managed expenses and generated a very healthy level of cash," said Lundgren. "We have moved quickly to establish a culture of growth at Macy's Inc. since reorganizing the company in 2008 and 2009, and yet we feel we are just beginning to take advantage of the benefits we envision," he said. The company expects revenue at stores opened at least a year for H2 to be up 4-4½% & it expects full-year EPS to be $2.60-$2.65, up from a previous guidance of $2.40-$2.45. Analysts had expected $2.58. M was caught up in today's selling & fell 41¢.
Macy's 2Q profit surges, boosts yearly outlook AP
Dow started the month (which seems like a year ago) at 12.1K. Already it has fallen 1.3K, a 10% decline! Bank of New York Mellon (BK) will lay off 1500, adding to the unemployment woes in the US. The chaos in DC drones on as the politicos are away on summer holiday as if they didn't have a care in the world. In one sense, that may be good. A lot of European debts are coming under increased scrutiny with talk about a possible downgrade for French debt. The VIX, volatility Index, shot up almost 9 to 44, far above the teens where it had been for most of this year & last. Now $2000 gold doesn't seem that far away, a scary thought for stocks!
S&P 500 Financials Sector Index
| Value | 166.35 | |
| Change | -9.75 (-5.5%) |
MLPs are defying the down markets. The index rose 5+ to the 347s but the REIT index fell almost 5 to 209. Junk bond funds pulled back 3% (big in that world) even though a continuation of low rates should be a plus. Treasuries are still in high demand around the world, seen as a "safe haven" investment. Oil rose from a 10-month low amid speculation that the Federal Reserve will implement a Q3 to bolster the economy & on signs that US crude supplies are shrinking. Gold gained for a 3rd session as a protection of wealth. Its 30 day chart is unbelievable.
JPMorgan Chase Capital XVI (AMJ)
Click below to get the latest market update:
Treasury yields:
U.S. 3-month | 0.015% | |
U.S. 2-year | 0.168% | |
U.S. 10-year | 2.149% |
| CLU11.NYM | ....Crude Oil Sep 11 | ...80.12 | .... | (1.0%) |
| GCQ11.CMX | ...Gold Aug 11 | .....1,773.50 | ... | (1.9%) |
Employers posted more job openings in Jun, a sign that hiring might improve a bit in the coming months. The Labor Dept said the number of available jobs rose to 3.1M, up from 3M in May to the highest level since Mar. Of course, this data is 40 days old already. Roughly 4.5 unemployed people, on average, were competing for each available job in Jun, down slightly from 4.6 in May. In a healthy economy, the ratio is about 2 to 1. The Jun number was higher than the 2.1M posted in Jul 2009, just after the recession officially ended & the lowest total since the gov began recording data a decade ago. But it's also significantly below the 4.4M openings in Dec 2007, when the recession began. High unemployment remains a burden on the recovery.
Job openings rose in June, though levels are low AP
Polo Ralph Lauren fiscal Q1 profit surged 52% on better-than-expected sales overseas & in the retail segment. The performance was well above expectations, & it raised its fiscal 2012 revenue guidance. RL, with brands including Polo by Ralph Lauren, Chaps & Club Monaco, had EPS of $1.90 for the qtr ending Jul 2, up from $1.21 last year. Analysts were expecting $1.44. Revenue climbed 33% to $1.53B as both retail & wholesale sales improved, handily beating $1.41B forecasted. Revenue from stores open at least a year rose 19%, while online sales climbed 28%. RL expects fiscal 2012 revenue to climb at a mid-to-high teens percentage rate, higher than its prior forecast of a mid-teens increase. Analysts expect revenue of $6.53B. For its Q2, RL anticipates revenue will rise at a high-teens-to-low 20% rate & analysts expects $1.76B in revenue. Even on a dismal day like today, good news can bring out buyers. The stock rose 7.70 (6½%).
Polo Ralph Lauren 1Q profit surges, lifts outlook AP
Polo Ralph Lauren Corporation (RL)
Photo: Yahoo
Macy's reported a 64% increase in Q2 profit as its strategy of tailoring merchandise to local markets is helping to overcome an overall sluggishness in the economy. CEO Terry J. Lundgren described Q2 as "the most successful second quarter and spring season in more than a decade." EPS climbed to 55¢ from 35¢ last year & revenue rose 7.3% to $5.94B. Analysts were expecting EPS of 48¢ on revenue of $5.84B. Revenue at stores opened at least a year rose 6.4%. "To date this year, we have driven significant additional sales growth, gained market share, maintained strong margins, managed expenses and generated a very healthy level of cash," said Lundgren. "We have moved quickly to establish a culture of growth at Macy's Inc. since reorganizing the company in 2008 and 2009, and yet we feel we are just beginning to take advantage of the benefits we envision," he said. The company expects revenue at stores opened at least a year for H2 to be up 4-4½% & it expects full-year EPS to be $2.60-$2.65, up from a previous guidance of $2.40-$2.45. Analysts had expected $2.58. M was caught up in today's selling & fell 41¢.
Macy's 2Q profit surges, boosts yearly outlook AP
Macy's Inc (M)
Dow started the month (which seems like a year ago) at 12.1K. Already it has fallen 1.3K, a 10% decline! Bank of New York Mellon (BK) will lay off 1500, adding to the unemployment woes in the US. The chaos in DC drones on as the politicos are away on summer holiday as if they didn't have a care in the world. In one sense, that may be good. A lot of European debts are coming under increased scrutiny with talk about a possible downgrade for French debt. The VIX, volatility Index, shot up almost 9 to 44, far above the teens where it had been for most of this year & last. Now $2000 gold doesn't seem that far away, a scary thought for stocks!
Dow Industrials (INDU)
Find out what's inside Trend TV!
Get your favorite symbols' Trend Analysis TODAY!
No comments:
Post a Comment