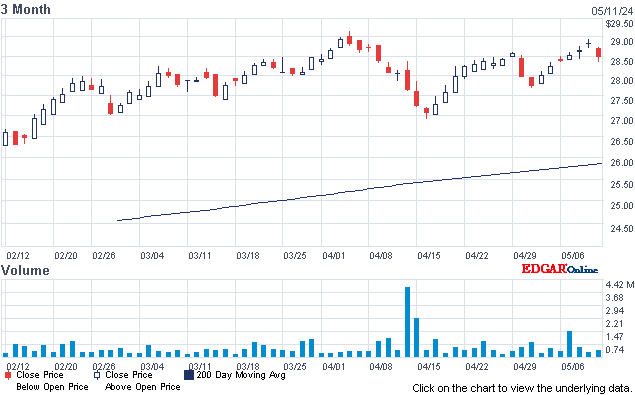
Dow dropped 47, decliners over advancers 3-2 & NAZ fell 15. The MLP index sank another 2+ to 260 shown in its dreary chart below & the REIT index gave back 1+ to the 362s. Junk bond funds continued to be sold & Treasuries climbed a little higher after recent selling. Oil lost 1 to the 55s & gold was off 1 to 1277.
AMJ (Alerian MLP Index tracking fund)

Home Depot (HD), a Dow stock, beat Q3 sales & profit estimates, as hurricanes Harvey & Irma boosted demand for storm-related emergency products & rebuilding materials. Sales at stores open for more than a year rose 7.9%, above the estimate of 5.9% & comparable sales at US stores increased 7.7%, above the estimate of 6%. Hurricane-related sales added about $282M to comparable sales. Home improvement retailers benefit from the sale of emergency storm-related merchandise such as generators, batteries & flashlights during hurricanes as well as from demand for rebuilding materials in the aftermath. EPS rose to $1.84 from $1.60 a year earlier. Net sales rose 8% to $25.03B. Analysts had expected EPS of $1.82 on revenue of $24.55B. The stock went up 40¢. If you would like to learn more about HD, click on this link:
Dow Jones Industrials

AMJ (Alerian MLP Index tracking fund)
Stocks headed for the biggest drop in 2 months, the $ fell & Treasuries rose as a risk-off tone spread across global financial markets. Oil led commodities lower, while gold rose on haven demand. The S&P 500 fell for the 3rd time in 4 days. Data showing Chinese growth is slowing sparked commodity declines that hit equities in Asia. The € rally weighed on European exporters, sending the region’s equity benchmark toward its longest slide in a year. West Texas crude & copper futures fell more than 1%. The yield on China's 10-year bonds breached 4% for the first time in 3 years & Treasuries yields slid after US producer prices in Oct beat estimates. Markets have been under pressure in the past week after a global rally took US stocks to records & Japan's to the highest in a quarter century. Investors yesterday focused on an ECB conference featuring Mario Draghi, Janet Yellen, Mark Carney & Haruhiko Kuroda, who commented about how their institutions communicate & guide markets. But there were few surprises & attention will likely now shift to anticipating the US inflation & retail sales numbers that could influence Federal Reserve interest-rate hike odds. Elsewhere, Venezuela was declared in default by S&P Global Ratings after missing 2 interest payments on its debt. Indian sovereign bonds fell for a 3rd day, with the benchmark 10-year yield reaching the highest since Sep 2016, on accelerating consumer inflation data.
U.S. Stocks, Greenback Decline as Euro Advances:
Markets Wrap
German growth steamed ahead in Q3, keeping Europe's largest economy on track for its best year since 2011. The 0.8% jump in GDP was an acceleration from the previous 3 months & topped the 0.6% forecast. Expansion was driven by exports & capital investment, & net trade made a positive contribution. The report confirms the Bundesbank's prediction that the economy carried its strong growth momentum into H2. That expansion is bolstering the euro area's upturn & supporting the global outlook, though it also means Germany is potentially straining against its maximum capacity, with repercussions for inflationary pressures. While Germany has long been an engine of expansion for the euro area thanks to robust domestic demand & striving exports, the rest of the region is catching up. Differences in growth rates between member states have shrunk to the smallest in the region's history & the European Commission said last week that the 19-nation region will grow this year at its fastest pace in a decade. GDP in the bloc increased 0.6 percent in Q3, according to an early estimate.
German Economy Beats Forecasts, Heads for Best Year Since 2011Home Depot (HD), a Dow stock, beat Q3 sales & profit estimates, as hurricanes Harvey & Irma boosted demand for storm-related emergency products & rebuilding materials. Sales at stores open for more than a year rose 7.9%, above the estimate of 5.9% & comparable sales at US stores increased 7.7%, above the estimate of 6%. Hurricane-related sales added about $282M to comparable sales. Home improvement retailers benefit from the sale of emergency storm-related merchandise such as generators, batteries & flashlights during hurricanes as well as from demand for rebuilding materials in the aftermath. EPS rose to $1.84 from $1.60 a year earlier. Net sales rose 8% to $25.03B. Analysts had expected EPS of $1.82 on revenue of $24.55B. The stock went up 40¢. If you would like to learn more about HD, click on this link:
club.ino.com/trend/analysis/stock/HD?a_aid=CD3289&a_bid=6ae5b6f7
Home Depot's profit jumps 10% on hurricane demand
Stocks are having a tough time finding friends. But Dow is down less than 200 from its record highs last week. That decline does not disturb the bulls. The goings on in DC are most important & the future of a tax bill remains very fuzzy, not good for investors who worry.. Home Depot's profit jumps 10% on hurricane demand
Dow Jones Industrials


No comments:
Post a Comment