This blog gives investors more financial information for very smart investing!
Wednesday, May 4, 2016
Markets drift lower on mixed economic data
Dow gave up 31, advancers barely ahead of decliners & NAZ fell 15. The MLP index lost 4+ to the 289s & the REIT index added 1 to the 339s. Junk bond funds pulled back & Treasuries were sold. Oil advanced & gold declined.
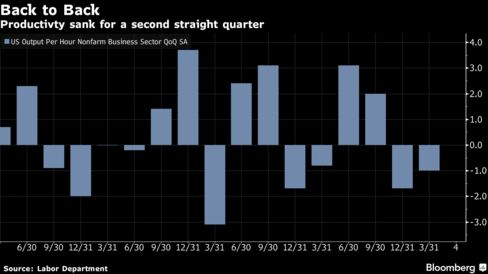
US worker productivity decreased for a 2nd straight qtr &
employer costs for labor climbed by the most in more than a year. The
measure of employee output per hour fell at a 1% annualized rate
from Jan thru Mar after a 1.7% decline in Q4. The estimate was for a 1.3% retreat. Labor costs jumped 4.1%, more than forecast.
Employers
have steadily beefed up headcounts to meet demand even as growth
softened the past 2 qtrs. At the same time, they’ve been hesitant
to ramp up investments in efficiency-boosting equipment, meaning
productivity will likely continue to languish. The productivity data showed
expenses per worker picked up in Q1 from a 2.7%
rate in Q4. These unit labor
costs, which are adjusted for efficiency gains, were forecast to climb
3.3%. Adjusted
for inflation, hourly earnings increased at a 3.4% rate in Q1, the most in a year, after rising at a 0.1% pace
the previous period. Output
advanced at a 0.4% rate, the weakest in 2 years, following a
1.5% pace. Total hours worked eased to a 1.5% rate from
3.3% in Q4. Growth
slowed to a crawl in Q1 as
consumers & companies alike reined in their spending amid weak global
financial conditions & a plunge in oil prices. When that
environment is combined with the uncertainty accompanying the election
season, the much-needed pickup in business investment may remain
elusive. That, in turn, doesn't bode well for workers’ wages as
companies strive to protect profits.
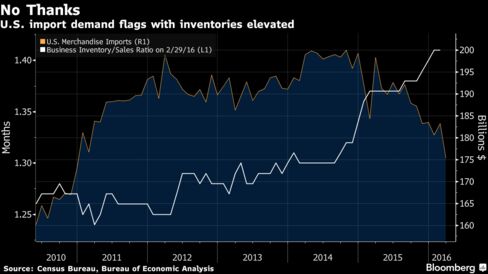
America's trade deficit shrank more than forecast in Mar as imports
fell in percentage terms by the most in 7 years & outpaced a
decline in shipments overseas. The gap narrowed 13.9% to
$40.4B, the smallest since Feb 2015, according to the Commerce Dept. The forecast was
for a $41.2B deficit. Imported merchandise declined 3.6%, the most since Feb 2009, as American companies worked to
get inventories in line with weaker Q1 demand. At the same
time, shipments overseas fell for the 5th time in 6 months amid soft
global sales. After eliminating the effects
of price fluctuations, which generates numbers used to calculate
GDP, the trade deficit narrowed to $57.4B from $63.2B a month earlier. The Mar real trade gap was the
smallest since Jul. The
initial estimate showed trade subtracted 0.34
percentage point from Q1 GDP when the economy expanded an
annualized 0.5%. Trade has contributed to growth in just one
qtr out of the last 6. Imports decreased to $217B, the smallest since Feb 2011, from $225B a month
earlier. The slump in purchases from overseas was broad-based &
included capital equipment, consumer goods & industrial supplies such
as oil.
The petroleum deficit narrowed to $3B, the smallest since 1999. Exports
decreased 0.9% to $176.6B from $178.2B
the prior month. Middling overseas demand hobbled orders for consumer
goods, which declined to a 3-year low. Exports of industrial
supplies were the weakest since Feb 2010.
American service companies expanded in Apr at the fastest pace in 4 months, signaling the economy is firming up after a weak start to
the year. The Institute for Supply Management non-manufacturing index rose to
55.7 from 54.5 in Mar. Readings above 50 signal growth. The forecast called for 54.8. The improvement shows service producers, which account for almost 90% of the economy, gained some traction following the slowest
quarterly growth pace in 2 years. Industries including retailers,
builders & health-care providers have been less vulnerable to weakness
overseas that’s kept pressure on US factories. The measure averaged 53.8 this year thru Mar, compared with
57.2 in all of 2015. The new orders gauge climbed to a 6-month high of 59.9
from 56.7 the prior month & the measure of services employment rose to 53
from 50.3. The business activity index, which parallels the ISM's factory
production gauge, eased by 1 point to 58.8 last month. A measure of
prices paid jumped to 53.4, the highest since May 2015 & indicating
costs were accelerating, from 49.1 the prior month. The supplier deliveries gauge, which
measures how quickly companies are able to process orders, held at 51.
Readings above 50 mean delivery times slowed, which is a positive signal
as it indicates companies were having a bit more trouble keeping pace
with demand.
Not much going on in the stock market. OPEC is looking to see if it can set production quotas next month & oil rallied. Don't hold your breath on that. Dow remains within 500 of setting a record high even though economic fundamentals are nothing to write home about.


No comments:
Post a Comment